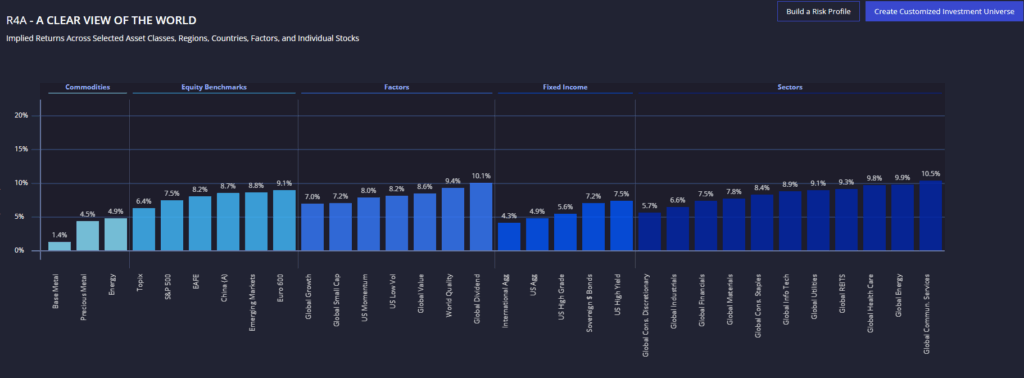
WHAT
The Compass is a proprietary algorithm that extracts the expected return implied by the market across all and any publicly listed asset classes (bonds, stocks, real estate, etc.), countries, sectors, industries, factors (value, growth, momentum, etc.), ETFs, and to individual security.
WHY
The first task of investment is all about identifying and ranking opportunities across an infinite universe of possible alternatives based on their expected future return and risk.
In order to run this task effectively, the ranking exercise must rely on a single and comparable metric that meets three crucial requirements; it must be:
Unbiased: the metric cannot be biased or modified by subjective judgments, that would otherwise distort and nullify the entire exercise.
Universal: the metric must be comparable across all asset classes … i.e., must allow to compare an equity with a bond, with a piece of real estate, with a commodity, etc.
Forward-looking: the metric must estimate future returns … and not report on past performance (driving by looking at the rearview mirror!)
HOW
We have conceived and developed the Compass by targeting these three requirements and by applying to the most basic and paramount law of finance big data approaches and reverse engineering techniques. Hence, the market-implied metric computed by the Compass is:
Unbiased: it is not tainted by any forecast or subjective views and reports just what the market implies, thus providing for an impartial and objective ranking.
Universal: the metric is derived by applying the most fundamental (and universal) law in finance measuring value across any form of investment, i.e., “the value of any investment – a stock, a bond, real estate, derivatives, etc., is equal to the sum of the future cash flow discounted back to present value.” The discount rate applied is equal to the future expected return comparable across any investment on the same basis.
Forward-looking: The rigorous application of this fundamental law refers by construction to future intrinsic value, only uses future flows data as input (no rearview mirror!) and does not rely on theoretical and often flawed models (e.g., CAPM) … altogether avoiding the pitfalls of data mining! I.e., it reports just what the market implies for future returns.
Practical Applications
Our metric has several investment-related applications; the most acclaimed are:
The most extensive and granular global value database providing on a real-time basis an unbiased and objective ranking of asset classes, markets, countries, sectors, industries, factors (value, growth, momentum, etc.), ETFs, individual stocks and bonds, etc. classified by their market-implied expected returns.
A state-of-the-art asset allocation and portfolio optimization tool based on a modified and more efficient version of the brilliant Black-Litterman construct. Our metric turns out to be a more robust estimate than the implied expected return calculated by the B&L model. Using our metric also removes the need of the original B&L model to identify a (purely theoretical) global market cap, a major conceptual and practical shortcoming of this otherwise brilliant construct for asset allocation and portfolio optimization.
A proprietary cutting-edge risk management system applying our unique concept of Intrinsic Risk to properly measure the probability of a permanent loss of capital (i.e., zero intrinsic value, 100 percent risk; 100 percent value, zero risk) … a quantum leap compared to the practice out there of confusing risk with volatility (and, worse yet, precisely measuring it with the Standard Deviation of past returns!) … and a remarkably effective and meaningful tool to calibrate portfolios based on the probability of reaching investment goals, relative and absolute.
The application and combination of these three “modules” consistently yield portfolios that are:
- Intuitive (i.e. reflecting subjective views and strategies),
- Forward-looking,
- Well-diversified (across value!),
- Efficient,
- With superior risk-adjusted attributes and, crucially,
- Applicable to any fully customized and tailored investment universe and strategy, for the most demanding retail and institutional investment goal.
Implied Cost of Equity (Ke) and Equity Risk Premium for Selective Assets, Markets, Sectors, Factors (Source: Lumen R4A, Compass, as of 12/31/24)


