
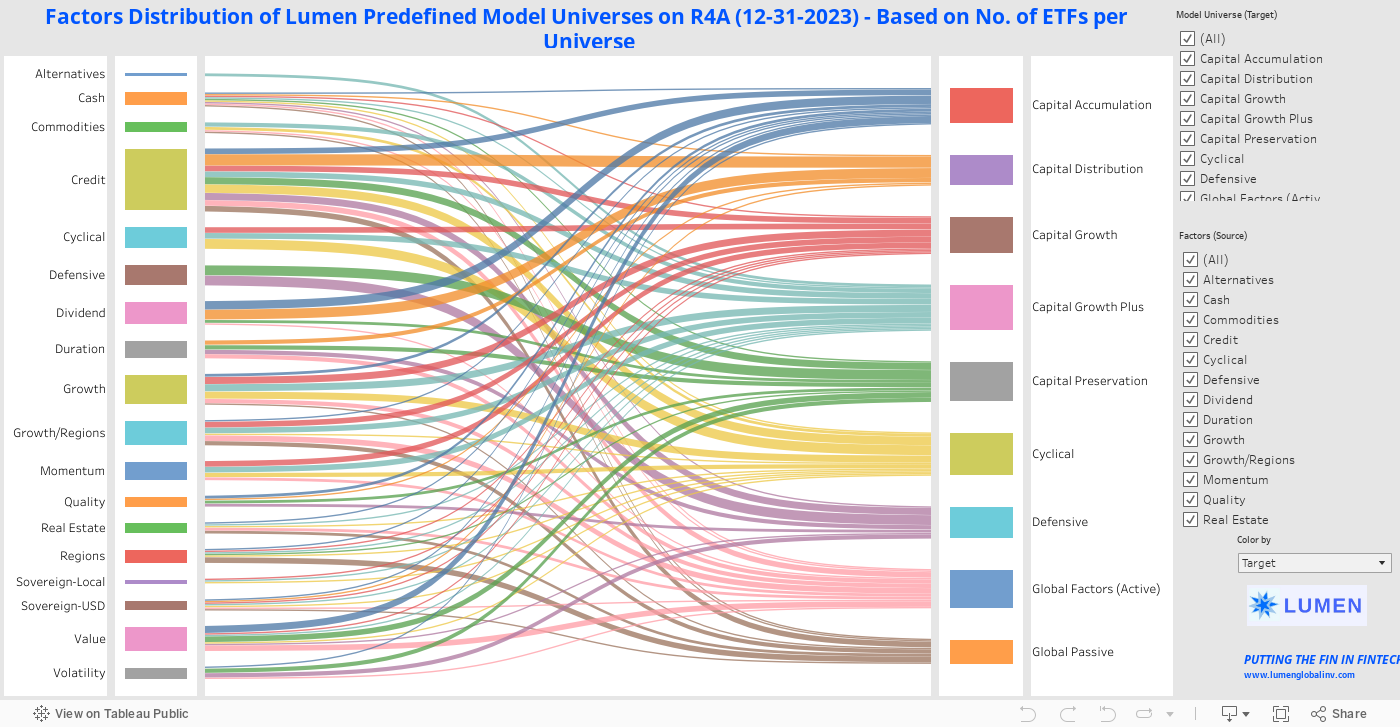
What Are the Factors/Ingredients in the Lumen Predefined Model Universes?
A tenet of Lumen’s asset allocation and portfolio construction process starts with clearly defining the investment objective, which can be mapped to a Predefined (Model) Universe, built up by factors that align with the investment strategies and investor’s goal.
The below Sankey diagram details the composition of each of the 9 Model Universes prescribed by Lumen. Each Universe comprises different factors (made up of different exchange-traded funds (ETFs)) acting as building blocks of a portfolio. These factors can overlap in the various universes. However, each combination of factors is unique and is dedicated to fulfilling a particular investment objective using a particular investment strategy.
The left-hand field represents the different factors in investing. The ribbons (flows) indicate how each factor is connected to a particular model universe (right-hand field). Each ribbon shows the percentage of ETFs within that factor as a percentage of the total number of ETFs in that model universe; i.e. the size of the factor in terms of the number of ETFs in a particular model universe.
Click on the interactive graph below.
Learn more about the factors in our model universes in this blog post.
Sources: Lumen Global Investments as of January 17, 2024
Using the Country Risk Curve for Asset Allocation Globally
If you find it difficult to identify which asset classes are cheapest and most expensive within a country, here is a good and internally consistent way to screen it.
Lumen calculated the cost of equity (refer to Lumen Global Value Compass), which is essentially the expected returns implied in the market, or IRR, that can be directly comparable with cash/bond yield (which is IRR).
Lumen has plotted a series of country risk curves categorized by region. The risk curve is a capital market curve showing the “yield” of each asset class from the risk-free, to higher risk such as various types of bonds, and finally equity (which should be the riskiest.)
The risk curve is normally upward-sloping but not always, and you can spot relative opportunities quickly. For example, if the cash rate is higher than say equity risk, then the equity market relatively more expensive.
Filter by region to see how the curves vary.
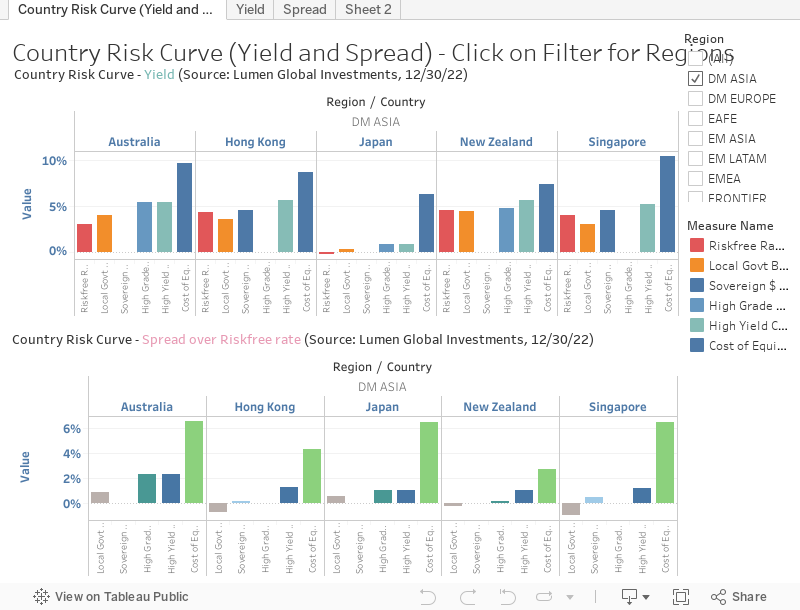
Sources: Lumen Global Investments, Bloomberg, data as of 12/30/22
How Sector Weightings Have Changed (As of March 2022)?
- US Info Tech and Internet Dominance
- Japanese Industrial Strength
- Chinese Financial and Consumer Power Rising
- Big French Consumer Discretionary Sector
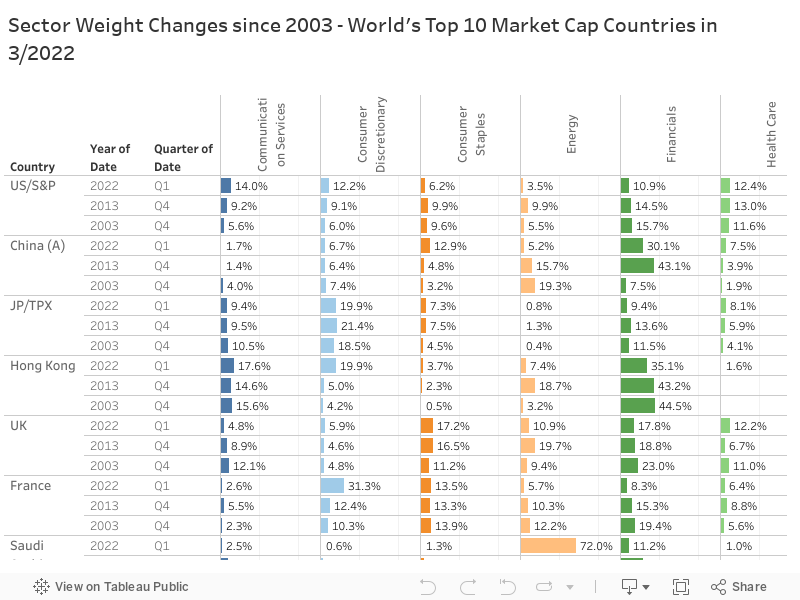
Sources: Lumen Global Investments, Bloomberg, selected stock exchanges, based on market capitalization weights
Who Benefits from the Soar in Fuel and Food Prices (2022)?
While some countries fare better (a lot of better sometimes) than others, each region has its share of winners and losers. Data is based on World Bank’s 2019 data.
Scroll and Click on any Region (at the top) to see selected data. Visit LGI in Tableau for all the details.
Largest ETFs by Fund Assets in the World – February 2022
The U.S. market has dominated for the last 20 years in market performance, but asset types, regional, sectors, and factor diversification opportunities abound.
Check out our January 2022 Market Intrinsic Valuation. Use the filters to see selected options.
Intrinsic Value vs Intrinsic Risk for Regional and US Sectors – January 2022 Interactive graphs
Source: Lumen Global Investments LLC, Lumen Global Value Compass (data as of January 2022)
Find out more details in our blog here.
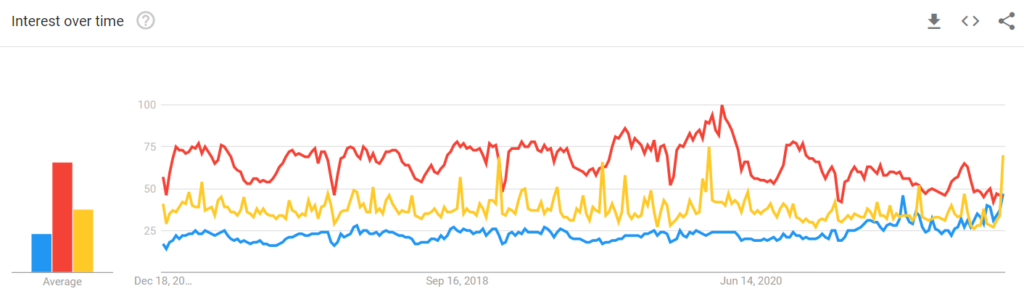
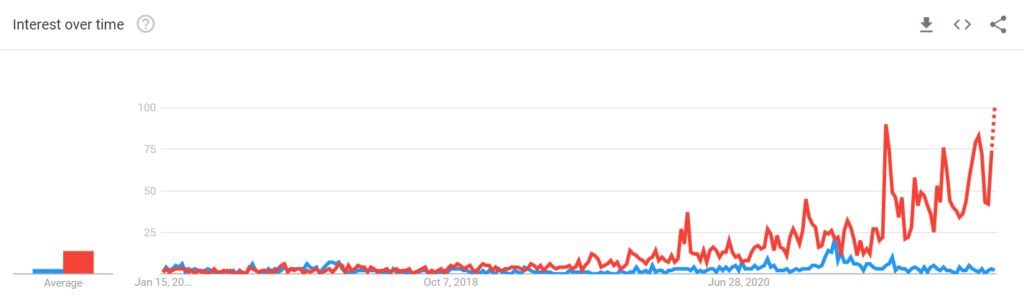
Inflation Scare?
According to the Google trends data looking at the last 5 years, worldwide search popularity of the keyword “inflation” and “Fed” exceeds that of “Economy” in mid-December 2021. [Note that the index shows the # of keyword search/# total searches at each point. The index is normalized as well. A maximum value of 100 means the search interest is at an all-time high for that particular keyword search. The index does not tell us the absolute search volume.]
Google Chrome may be better to view the graphics.
https://trends.google.com/trends/explore?date=today%205-y&q=Inflation,Economy,Fed
For our latest views on global inflation, please read here for the report: “Navigating the Inflation Scare.”
Intrinsic Value vs. Intrinsic Risk for Regional, Emerging, and Major Markets – March 2021
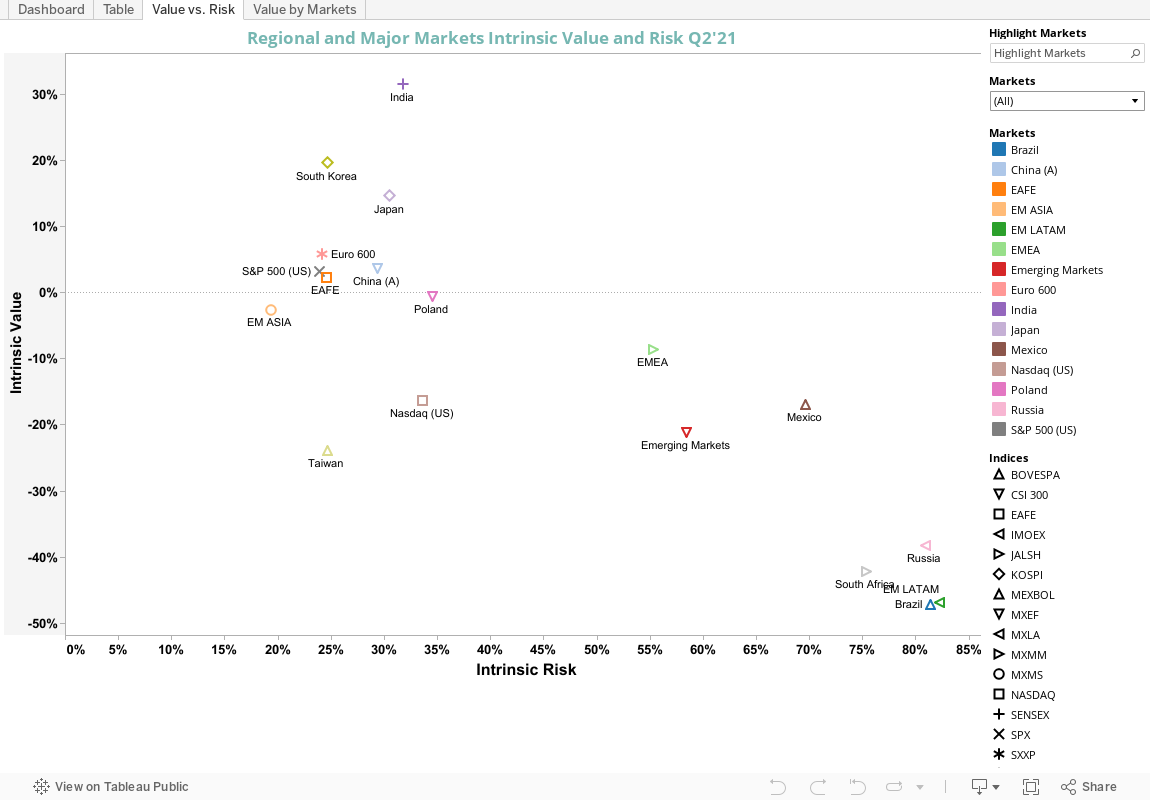
Source: Lumen Global Investments LLC, Lumen Global Value Compass
Find out more details here.
Intrinsic Value vs. Intrinsic Risk for China A-Share Market and Sectors – March 2021
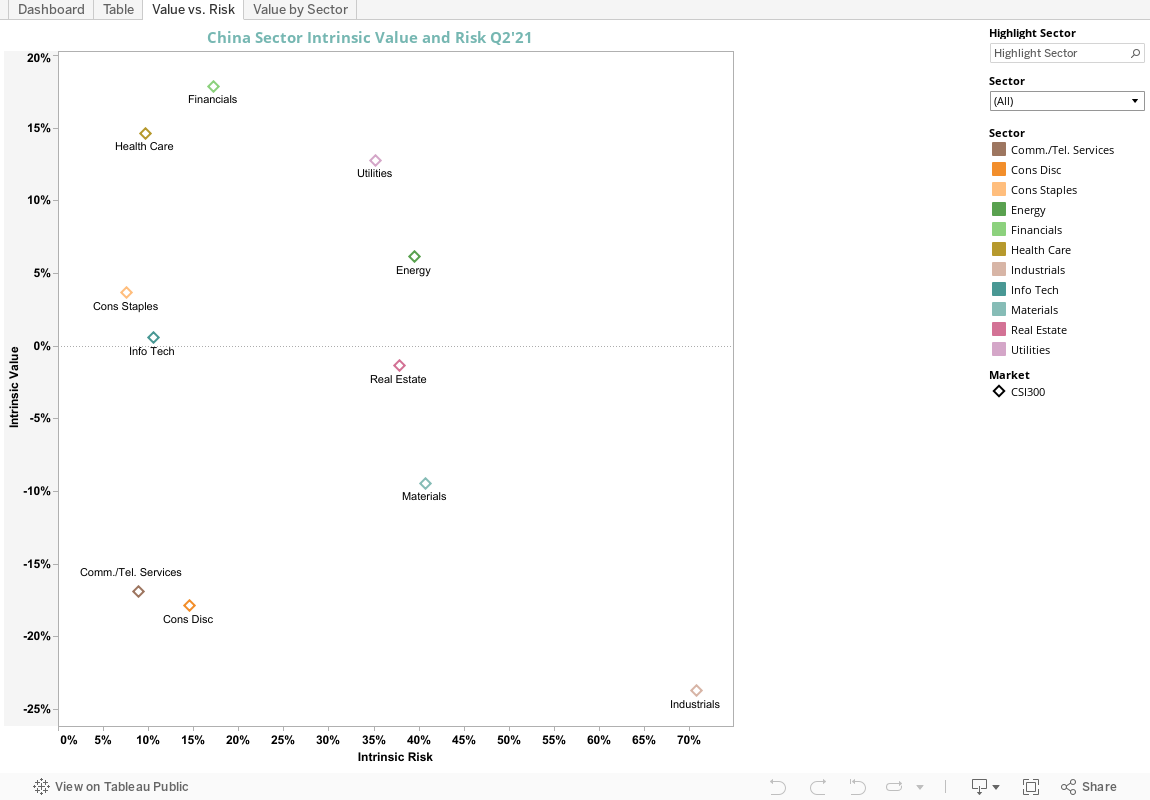
Source: Lumen Global Investments LLC, Lumen Global Value Compass
Read more in our blog here.
Current World Market Capitalization Distribution
- DM dominates equity market capitalization (72% of total)
- EM (27% of total) is quite a bit larger than Europe (17%)
- ASIA (27%) is the second largest market cap region, behind North America (47%).
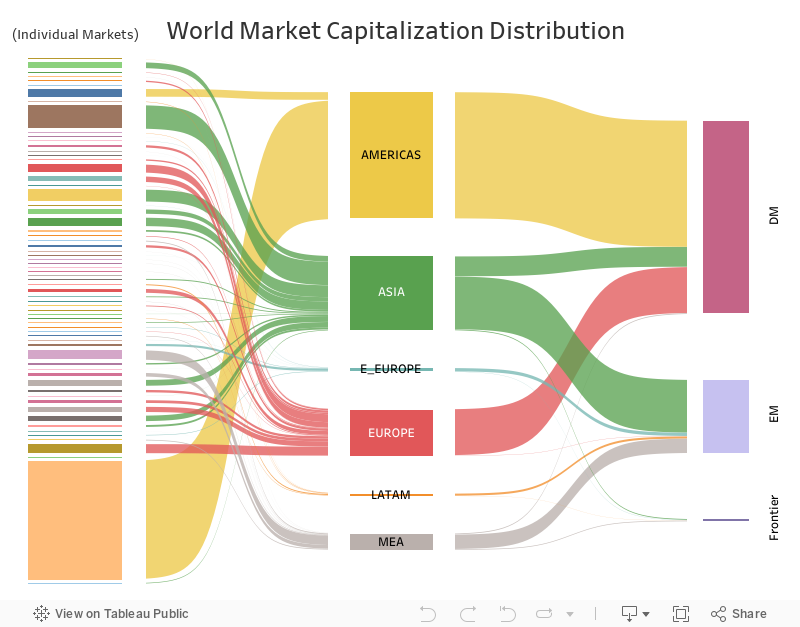
Source: Lumen Global Investments; based on one major benchmark per country; Template Credit to Vizible Difference; data as of November 30, 2020
Where is the Leverage in the World?
The top 10 most leveraged countries are in the developed markets using Q2 2020 data – on average doubling that of the EM/Frontier Markets.
The rate of increase is alarming in North America, EM LATAM, and Frontier MEA.
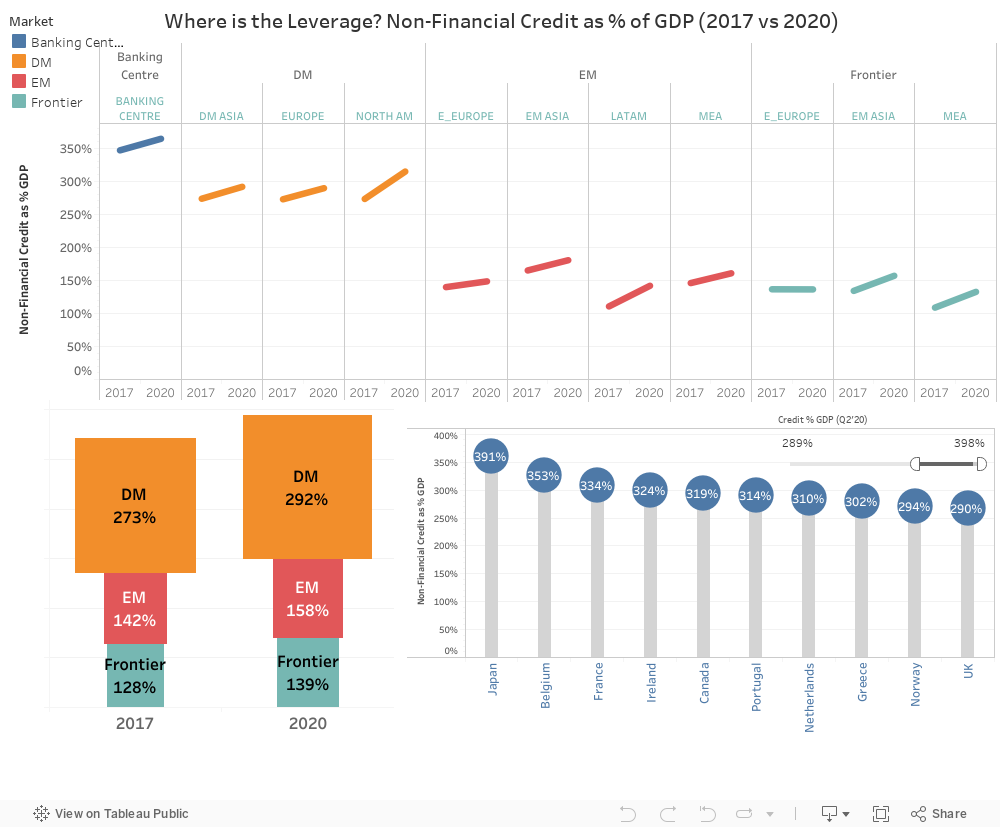
Sources: Lumen Global Investments, IMF, World Bank, BIS
Growth Drivers of the Largest Economies
One common misconception is that China is a big trading nation or has a large open economy given the amount of consumer or manufacturing goods that are made in China or the US-China trade bickering that are in the news.
Looking closer at the GDP components and how big total trade is as a percentage of GDP, China’s growth engine comes mainly from domestic investment and private consumption while net exports (exports minus imports) was only 1% of GDP.
Switzerland, on the other hand, has a huge positive net exports at 13% of GDP, making trading of goods and services a bigger source of growth.
U.S. is most dependent on domestic consumption as the primary growth engine (68% of GDP) amongst the top economies, with U.K. and Mexico at 65% of GDP.
The size of domestic consumption in the U.S. is almost the same size of the entire GDP of China while the size of personal consumption in China is larger than the whole GDP of Japan!
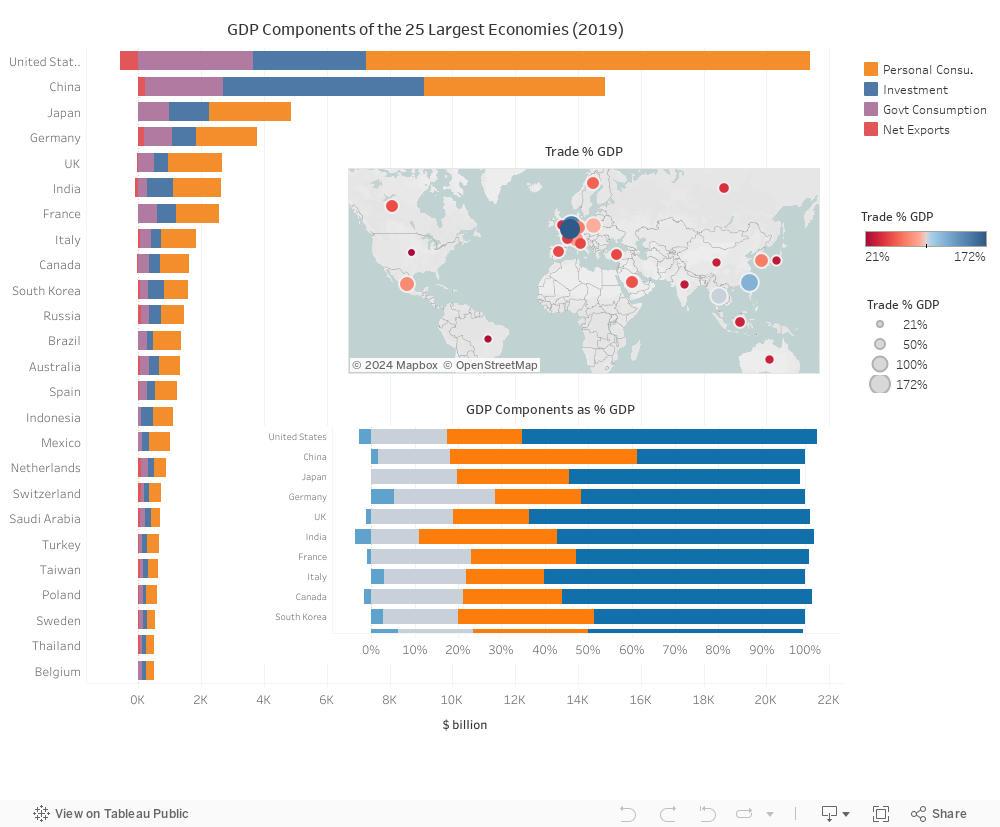
Sources: National Statistics, World Bank, UN Data
Leverage General Intelligence for Market Greed and Fear
Worldwide Search for “Stock Market Bubble” and “Greed and Fear” (A value of 100 shows peak popularity of the term in that region) – Source: Google Trends (Google Chrome Works Better for the Graphics!)
How Sector Weightings Have Changed?
- US Info Tech and Internet Dominance
- Japanese and German Industrial Strength
- Chinese Financial and Consumer Power Rising
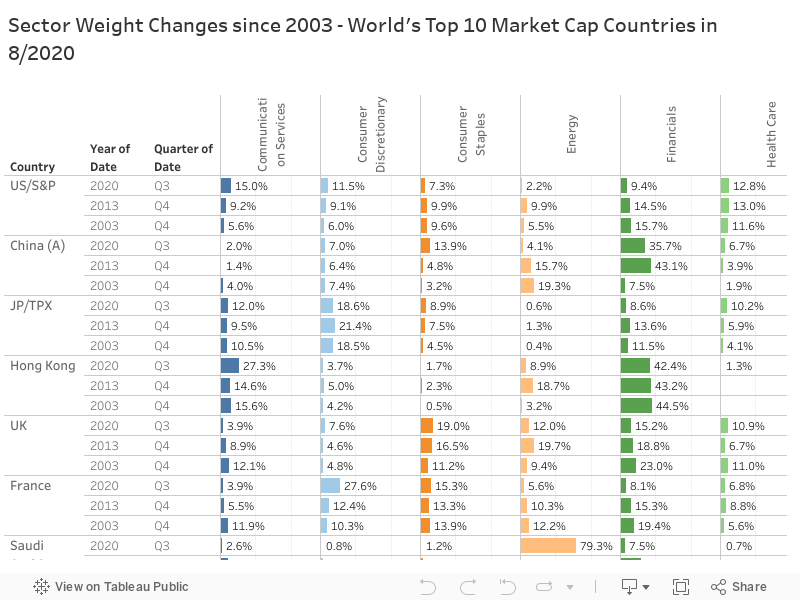
Sources: Lumen Global Investments, Various Stock Exchanges; based on market cap weights
Lumen’s Q4 Major Market/Region Outlook – Intrinsic Value vs Intrinsic Risk
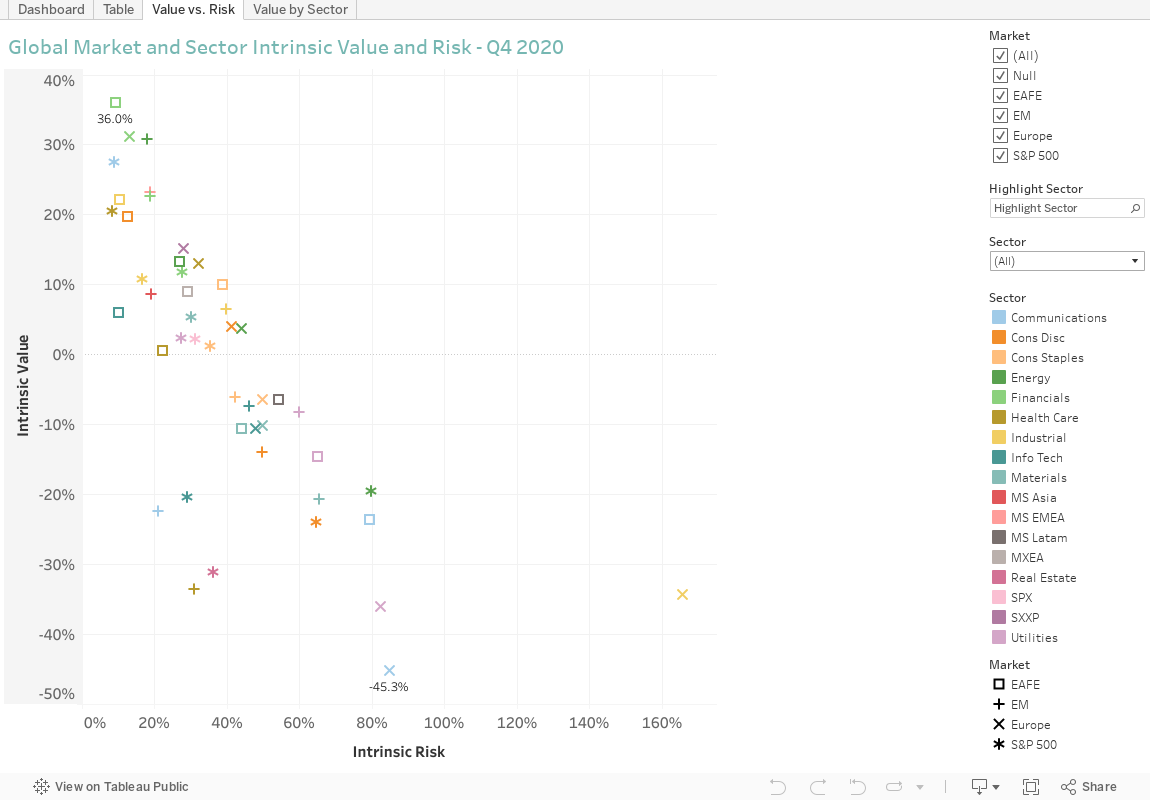
Source: Lumen Global Investments, Lumen Global Value Compass
Read the full investment outlook here.