The 60/40 is Dead … Long Live Modern Portfolio Theory
The 60/40 portfolio, comprised of 60 percent equity benchmarks and 40 percent bonds, has remained a cornerstone of the wealth management industry for many decades. Its enduring value and efficiency as an optimal allocation strategy – i.e., the highest return for a certain level of risk – have solidified its status as a benchmark for moderate risk investment strategies that can be tailored and tweaked into variations, e.g., conservative (or 20/80), and aggressive (or 80/20) portfolio. Yet, the recent surprising and disappointing performance of the strategy has triggered a fierce debate over its long-term value. This debate however misses the forest for the tree. While the 60/40 cookie-cutter practice is indeed obsolete, the criticism over its validity has, if anything, renewed interest in efficient and optimal portfolio construction in line with Markowitz’s teachings and at the core of the 60/40 approach itself! Indeed, with today’s avalanche of free data, computing power, AI, digital platforms, and financial innovation, there is tremendous scope to build highly diversified and customized portfolios closely matching the investor’s risk tolerance profile and goals … a quantum leap from the cookie-cutter 60/40 dull strategy and its indiscriminate conservative, moderate, and aggressive variations.
Please read the rest of the article here.
The Black-Litterman Model – Misuses and Abuses
The Black-Litterman (B&L) model is possibly the most advanced and conceptually attractive portfolio construction and asset allocation model out there.
Yet, it is also the most misused and abused.
In particular, the new breed of digital portfolio construction platforms (or Robo Advisors) has been keen to claim the academic rigor and sophistication of this Nobel Prize studded construct, while in truth knowingly providing investment solutions that can easily be replicated with … a common Excel spreadsheet.
These unscrupulous marketing gimmicks are made possible by operational loopholes of the B&L that, under specific assumptions, reduces the precept of the model to basic passive (index) investment management or, worse yet, generates bogus results. Please download the paper for more details.
Equity Multiples: Myths, Mania and Alchemy
A valuation riddle … wrapped in a mean reversion mystery … inside an accounting enigma
- Multiples such as Price Earnings Ratios have no theoretical foundations and zero economic value meaning.
- However, they are often preferred over the more robust and explicit Discounted Cash Flow (DCF) methodology, which is the gold standard of valuation.
- Simon Nocera posits in this paper that they are best treated as momentum indicators and barometers of market sentiment rather than serious fundamental value metrics.
Explore Simon Nocera’s paper here.
The Anatomy of Portfolio Risk
While working on factor investing, I was reminded of several famous studies reporting on an “anomaly” in finance theory, i.e. stocks with low volatility have better returns compared with stocks with much higher volatility.
This obviously goes against the well-established assumption of rational investors — investors prefer more return and less risk — and efficient markets – investors realize higher return by taking more risk. In the more popular explanation that I know of, this anomaly is attributed to Behavioral Finance (see Benchmarks as Limits to Arbitrage: Understanding the Low-Volatility Anomaly – Malcolm Baker, Brendan Bradley, and Jeffrey Wurgler).
What I found amusing is that no academic is questioning a simple fact: could it be that, in testing this anomaly, they are using the wrong metric for risk? Could it be that we continue to confuse risk with volatility and, more dangerously, we precisely measure risk with momentum or derivatives of a Normal Distribution? Would it not be more practical to test a conceptually more robust assumption: risk is lack of intrinsic value, i.e. zero intrinsic value, 100% risk, and high quality/value, low risk? Following is an internal piece we penned on “financial” risk reflecting our take on the subject…
Please read the rest of the article here.
Are Actively Managed Mutual Funds Doomed?
The mutual fund industry is facing an existential crisis that could lead to its demise or at the very least usher in radical changes in its business model and service line. To that end, last week (September 11, 2019) marked a watershed moment: Bloomberg News reported that assets in index-based U.S. equity mutual funds and exchange-traded funds topped those run by stock pickers for the first time in August — $4.271 trillion invested in U.S. stock index funds, compared with $4.246 trillion in those run by stock pickers.
The news reinvigorated the ongoing debate on active versus passive management as a” either or”, as if these were the only two alternatives and mutually exclusive options to manage money successfully. There is in fact a third alternative which is not only consistent with the evolution of innovative financial techniques, but most to the point yields attractive performance: active asset allocation and its operational aspect of optimal portfolio construction.
Read the rest of this article here.
The Power of Global Asset Allocation using the Lumen Global Value Compass
Despite its well-known benefits, the power of asset allocation as a successful investment process has become more apparent and popular only recently. Indeed, the poor performance of most active managers, particularly in the long-only world, has rekindled the need to seriously consider the various methods of asset allocation and its more mechanical aspect of portfolio construction as a process and venue to outperformance. Amongst these, the Black-Litterman model is the recognized groundbreaker methodology.
Nonetheless, this brilliant construct does have shortcomings in that it relies on the CAPM and its thwarting assumptions to determine the market implied expected return, the starting neutral point in the B&L model. Lumen’s methodology and modification of the B&L model successfully bypass and outwit the well-known shortcomings of the CAPM and their impact on the B&L, yielding much more intuitive and forward-looking asset allocation, with far higher attributes measured for example by a higher Sharpe Ratio relative to the original B&L model.
Portfolio Construction and Global Asset Allocation Tweaked by the Lumen Ke – Simon Nocera
This paper presents a variation of the Black-Litterman Model (B&L) for portfolio construction and global asset allocation practices using the Lumen Global Value Compass-derived Cost of Capital (Ke) without relying on flawed models or weak assumptions.
The methodology proposed retains the Bayesian approach of the original B&L model and, in particular, the derivation of the Posterior Vector of expected market returns incorporating subjective investors’ views. The variation from the original model we are presenting is in the construction of the Prior Equilibrium Vector of implied market return (B&L Market Equilibrium Starting Point), which we derive without the help of questionable models (e.g. the CAPM), without restrictive and subjective assumptions, without the need to pre-determine an all-encompassing investment universes/global benchmarks, and without forecast.
Our version of the vector of market implied expected returns provides an unbiased and more robust equilibrium starting point, thus generating superior portfolios as measured by the Sharpe Ratio when applied to the Black-Litterman construct to determine the Posterior Vector. In addition, our methodology can start from any subjective investment universe, thus completely removing the logistical hurdle of defining a global universe.
Read about Simon’s paper here.
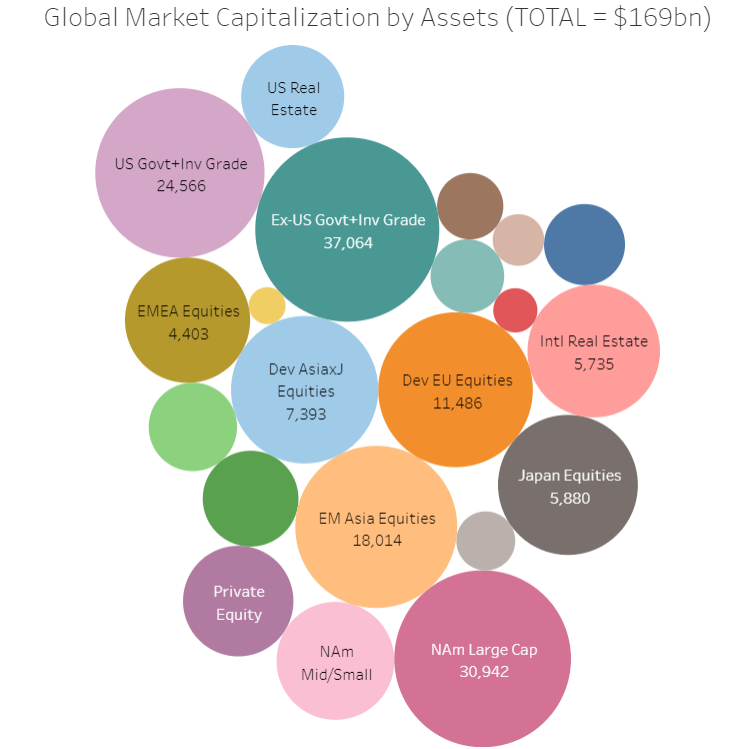
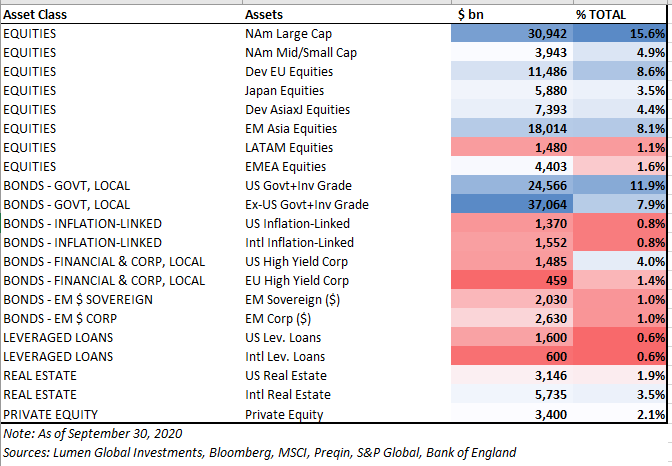
Global Market Universe Infographics (Lumen Estimates)