

Overview
Factor investing is an investment approach where investments are chosen based on quantifiable characteristics or “factors” that drive the differences in risk or rate of return of stocks. Common factors include size (market cap), growth, value, quality, dividend, momentum, and volatility.
Recently, factors have become more popular in portfolio construction for investors who want to harvest risk premiums from certain investment styles. These “smart beta” strategies have racked up inflows reaching 16% of total equity ETF AUM in the U.S. according to F.T.
In times of uncertainty, especially the past year, investors have stronger preferences for dividend, low volatility, and value strategies as opposed to the broad market cap-based index strategy, which tends to tilt towards growth companies.
In this piece, we will look at the evolution of factor investing and then discuss how Lumen quantifies the various factors in R4A and share our findings. While Lumen adopts the traditional factors, we have one unique exception: we do not use Multiples as metrics of value. Lumen instead applies the economic value concept to measure value (Economic Value Added or EVA), proxied as the difference between net profits and costs, or Return on Equity (ROE) minus the cost of equity (Ke).
How Factor Investing Has Evolved
In searching for better risk-adjusted returns away from market cap-based strategy, researchers and quantitative managers have long been discovering/practicing factor-based investing in their selection, weighting, and rebalancing of securities.
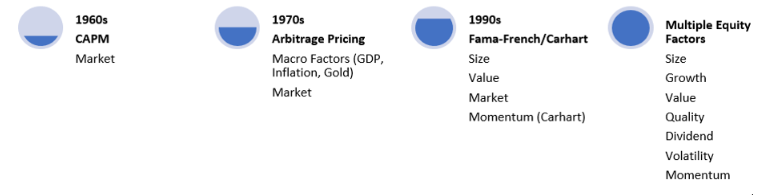
Factors investing originated from the CAPM theory in the 1960s which posits each stock’s return is sensitive (beta) to one degree or another to one factor – the market exposure. The beta measures the risk of a stock and is not a source of long-term outperformance. In the 1970s, Stephen Ross found that multiple macro factors might better explain stock excess returns than CAPMs. Researchers Eugene Fama and Kenneth French found more market anomalies, size (small), and value, that explain the stock returns in addition to the market factor. Carhart later added Momentum. Common factors now include size, growth, value, quality, dividend (high-yield), volatility (low and minimum vol), and momentum.
Smart beta or factor-based investing bridges the gap between active and passive investing. As Morningstar’s Ben Johnson said: the common thread among smart beta ETFs is they seek to either improve their return profile or alter their risk profile relative to more traditional market benchmarks.
Two important facts about factors investing to highlight:
(1) The Norwegian Government Pension Fund, the largest sovereign wealth fund in the world, found out (unknowingly), at an aggregate level, well-known factors such as value, size, momentum, and volatility accounted for about 70% of the excess return of their portfolio of managers (Ang, Goetzmann, and Schaefer (2009)) during the 2008-9 Great Financial Crisis.
(2) No single factor can outperform the market at all times. Some factors are indeed more successful than others in providing excess return over the long term, but these factors’ short-term performances can be lacklustre.
A better approach to factor investing is to understand fully the underlying factor attributes of your exposures to gain diversification as well as your risk allocation, i.e., build up an optimal and dynamic portfolio in alignment with your overall risk preference and investment goals.
Equity Factors and What Goes into Each Factor
Lumen adopts the traditional factors used in the industry. However, instead of Multiples, we apply the Economic Value Added (EVA) concept, proxied as the difference between net profits and costs or a positive spread between Return on Equity (ROE) and cost of equity (Ke), to measure value. EVA is part of the input into our factors: Value, Growth, and Quality.
For each factor, we first select a set of specific inputs, assign appropriate weights, and adopt Z-Scoring to rank securities across all 60+ global market indices (country/region-agnostic). Finally, we select the final set of securities that meet all our criteria and are above a certain threshold.
Factors
Here are the input and the underlying variables we use to select the stocks universe for each factor.
Size (market capitalization):
| Developed Markets Minimum Size | Emerging/Frontier Markets Minimum Size | |
| Large Cap | $22bn | $11bn |
| Mid Cap | $7bn | $4bn |
| Small Cap | $0.6bn | $0.3bn |
Growth:
- Positive long-term historical sales per share growth: last 5-year sales per share growth
- Positive long-term historical EPS growth: last 5-year EPS growth
- Positive Long-term ROE trend: last 5-years growth
- Positive economic value added: ROE (last 1 year) minus Ke
Value:
Here, Lumen does not focus on low multiples but on the positive EVA spread and stable metrics.
- Stable long-term historical sales per share growth: last 5-year sales per share growth
- Low/stable earnings variability: last 5-year EPS growth
- Positive dividend payout ratio
- Positive free cash flow yield
- Positive trailing 12-month ROE
- Positive economic value added: ROE (last 1 year) minus Ke
- Positive Equity Risk Premium: Ke minus the country risk-free rate
Dividend:
- Positive dividend yield (last 12 months)
- Positive dividend payout ratio (last 1 year)
- Positive long-term dividend per share growth: last 5-year DPS growth
- Positive short-term dividend per share growth: last 1-year DPS growth
Quality:
- Positive trailing 12-month ROE
- Debt to equity (last 1 year)
- Low/stable earnings variability: last 5-year EPS growth
- Positive economic value added: ROE (last 1 year) minus Ke
Momentum (Lumen adopts the industry standard):
- Volatility-adjusted 6-month price change: 6-month price change adjusted by past 3y realized volatility, excluding past 1-month performance
- Volatility-adjusted 12-month price change: 12-month price change adjusted by past 3y realized volatility, excluding past 1-month performance
- Trailing P/E ratio (for reference)
Low Volatility (Lumen adopts the industry standard):
- Realized past 2-year price volatility
- Realized past 12-month price volatility
- Realized past 90-day price volatility
- Low/stable earnings variability: last 5-year EPS growth
Comparing Results Using Regional Factor Benchmarks and Lumen Factors Classification
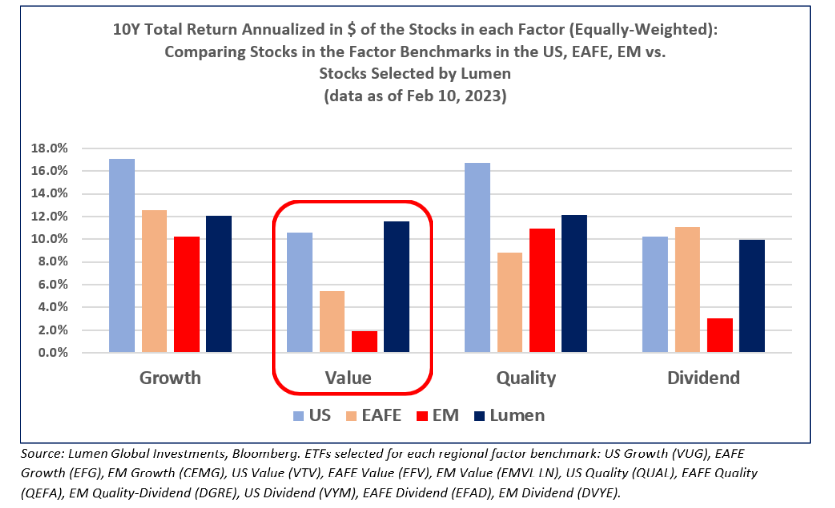
We compared the past 10 years annualized total return in US dollars of the stocks currently held in each factor benchmark (proxied by an ETF) in different regions and the current stocks selected by Lumen for each factor. Each stock is equally weighted.
We noticed the stocks selected by Lumen generally have consistent long-term historical performances (in the range of 10-12% p.a.) across the various selected factors.
Final Thoughts
Research and historical performances have shown that factors exposure offers a strong case to potentially enhance returns and alter risk profiles in a broader portfolio. Factor investing, or smart-beta strategies, are important building blocks in asset allocation or a core-satellite investment approach.
We have shared how Lumen screens for each factor. We have also shown that Lumen’s unique value metric, Economic Value Added as proxied by the positive spread between Return on Equity (ROE) and the implied cost of equity (Ke), provides a unique approach to the traditional factors adopted in the industry.
Knowing the rationale behind each input into a factor and whether those inputs make sense is crucial.
More important in factors-based investing is the ability to construct an optimal and intuitive portfolio, as in Lumen’s R4A, using these factor exposures that align with the investor’s style, risk preference, and investment goals, and the ability to know how these exposures fit within the broader portfolio.