
Please click on the Interactive Graph above or use this link.
The starting point of Lumen’s portfolio construction and asset allocation process is to help investors clearly define their investment objective, which can be mapped to a Predefined (Model) Investment Universe (“Predefined”) well-suited to achieve the investor goal.
Lumen has created 9 investment universes that satisfy a host of investment objectives such as capital preservation, capital distribution, capital accumulation, capital growth, aggressive capital growth, and trading.
Each predefined model universe is made up of building blocks of global Exchange-Traded Funds (ETFs) represented by “equity factors” including dividend, growth, value, volatility (low or minimum), momentum, quality, regional, cyclical and defensive sectors, “bond factors” including duration, credit, and sovereign (dollar and local currency-denominated) as well as “alternatives” including real estate, alternatives, and commodities.
Two points to note about the Lumen Predefined Universes: First the composition of the investment universes is not defined by historical volatility but by the desirable factors that best represent that investment universe. For example, the capital preservation universe does not contain mainly or only bonds but a highly diversified mix of factors across asset classes and markets to mitigate investment risks.
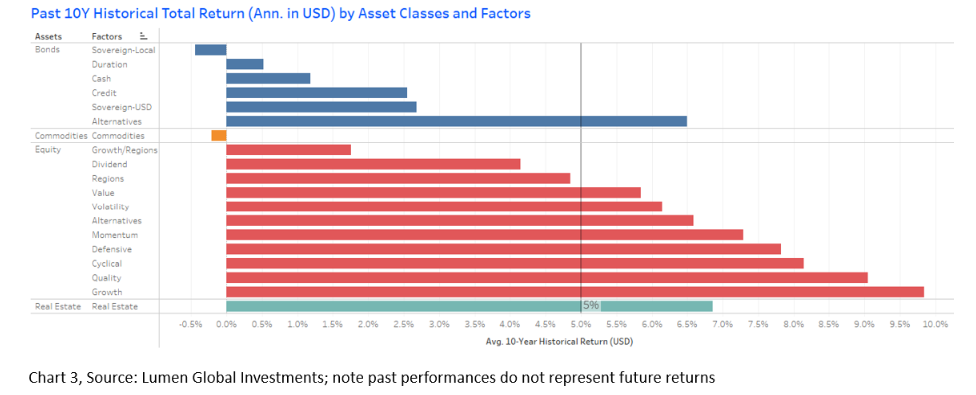
Secondly, the Predefined Universes and the resultant final portfolio return reflect the expected returns available in the market and are not necessarily based on historical performances. For example, on average high-growth factor ETFs earned about 10% p.a. in the past 10 years, but the implied expected return is currently 7.6% given how well the strategy has performed. A duration (bonds) strategy returned about 0.5% p.a. in the past 10 years, but looking forward, the average yield is closer to 4% (see Charts 3 and 6).
Compositions of the Predefined Universes Reflect Investor’s Expected Returns, Goals, and Risk
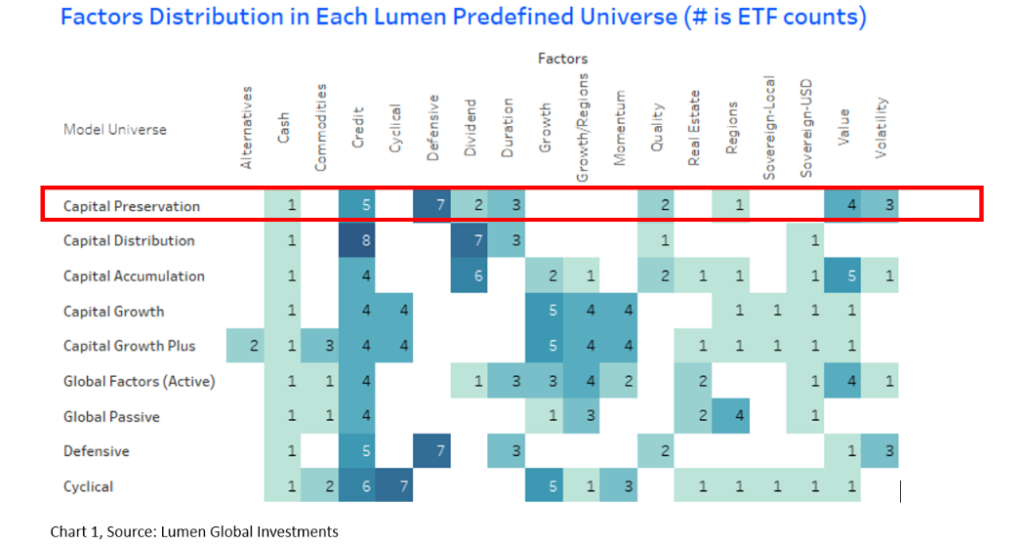
Let’s say an investor whose primary goal is to maintain the purchasing power of her investments and minimize the risk of loss may have a goal of capital preservation with an expected return of less than 4% p.a. The corresponding investment strategy is conservative, and the appropriate universe is “Capital Preservation”.
The pre-selected investment holdings in this universe have relatively lower risks as in short-term government bonds and investment-grade credit, and equities that focus on dividends, quality, value, and low volatility and defensive sectors including health care, utilities, and consumer staples (see Chart 1, Capital Preservation universe).
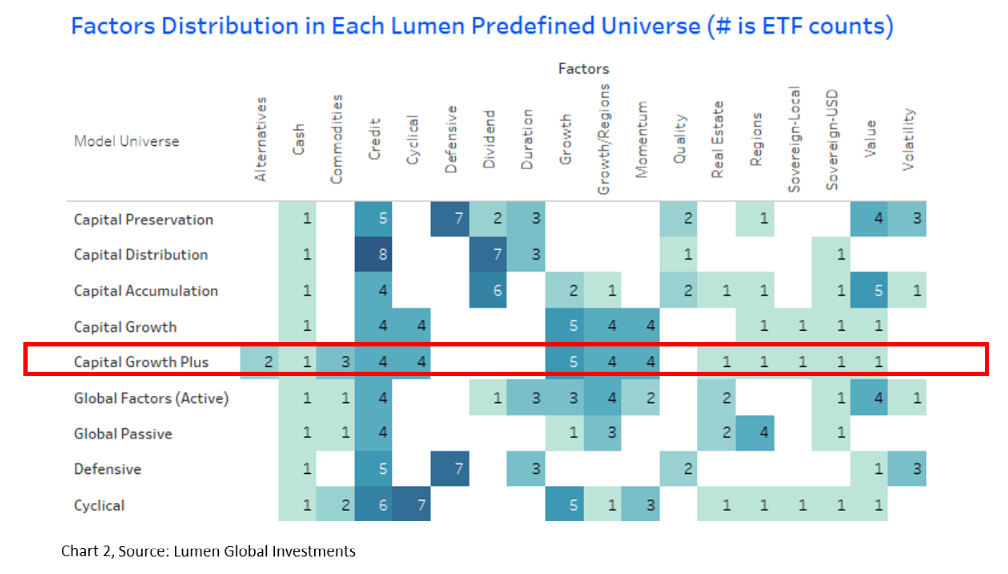
In contrast, an investor with a long-time horizon who desires a growth-oriented strategy and substantial capital appreciation (e.g. higher than 10% p.a.) relative to the market may select an Aggressive Capital Growth objective. The corresponding universe is “Capital Growth Plus”. This strategy involves higher risks and invests in high-growth/volatility, small-caps, momentum, and cyclical sectors such as technology, materials, consumer discretionary, industrials, etc. The investment universe includes higher-growth regions in the emerging and frontier markets, alternatives such as private equity/credit as well as sovereign bonds (both USD and local-denominated) (see Chart 2, Capital Growth Plus Universe).
How Did the Factors Perform in the Past?
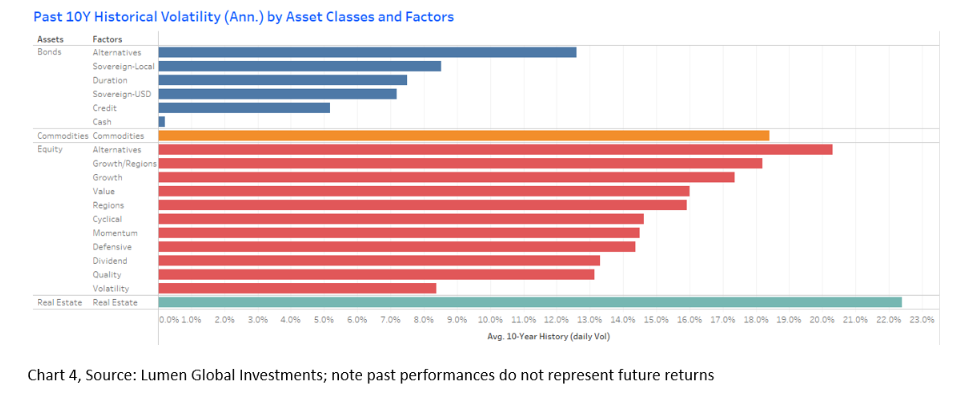
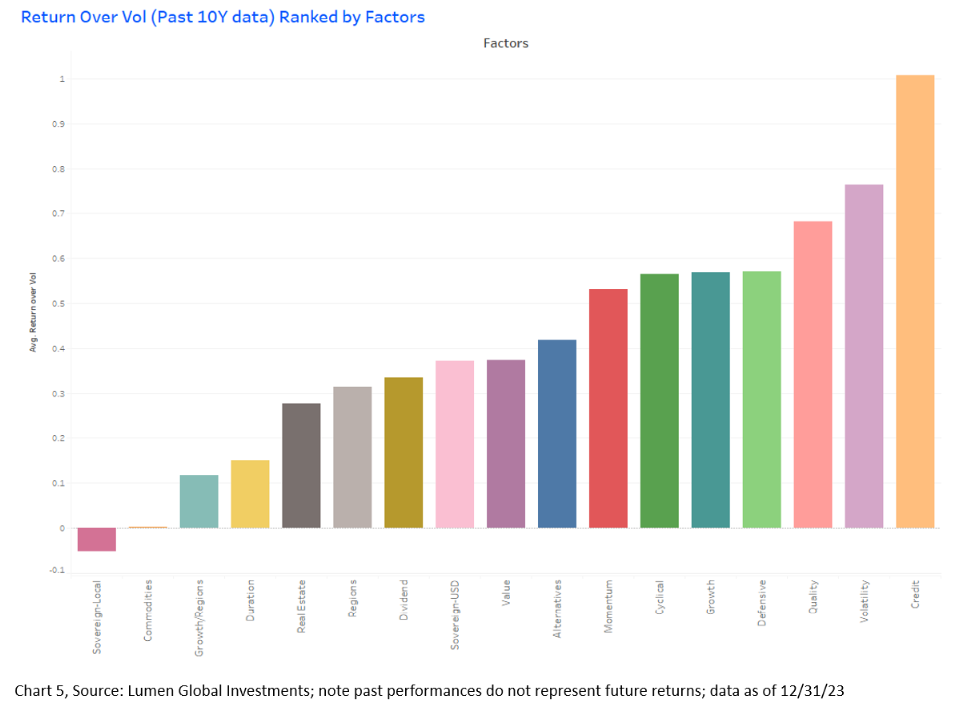
The below charts show the historical attributes of the different factors in terms of historical total return and volatility, and information ratio (return over vol).
Total Return (annualized in US Dollars) for the period 12/31/13 to 12/31/23 (10 Years)
Return over Volatility (Past 10 Years) Ranked by Factors
The top 3 risk-adjusted return factors are credit, volatility (low and minimum), and quality. The high score of credit is helped by the inclusion of senior loans which have a very positive ratio (3.89), European High Yield (1.11), and Emerging Markets Corporate Bonds (0.75) using the past 10 years of data as of 12/31/23.
What to Expect Going Forward?
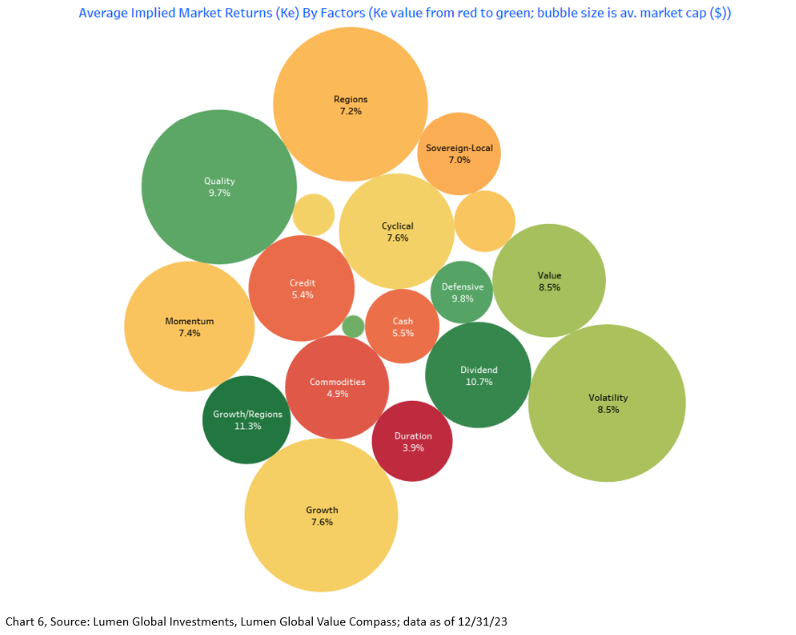
Based on Lumen’s Value Compass calculated implied market returns (aka the implied cost of capital or Ke) using data as of 12/31/23, we can rank and rate value across asset classes, regions, countries, sectors, industries, down to individual securities and ETFs.
We currently find relative value in growth regions such as EM Asia, Eastern Europe/LATAM and frontier markets, high dividend, quality, low volatility, value, and defensive stocks as well as alternatives (the darker green colour represents better value), followed by growth, cyclical, and momentum stocks.
Using the building blocks of “factors” ETFs for the 9 investment universes, we can cater to a range of investment objectives. We then optimize the ETF allocations based on Lumen’s enhanced Black-Litterman portfolio construct modified by Lumen Cost of Equity (Ke) [1] (implied market expected returns) and come up with the efficiency frontier of that investment universe representing over 15 asset allocations (portfolios). Investors can choose the most desirable asset allocation on the efficiency frontier according to their needs, risk tolerance, and capacity.
✔ Building on the Lumen Predefined (Model) Universes,
✔ Powered by an objective, unbiased, and forward-looking valuation metric (Ke) and
✔ Using the industry gold standard portfolio construction method, the Black-Litterman enhanced by Lumen Ke,
the result is a highly customized and intuitive portfolio based on investment strategies best aligned with the investor’s goals and risk profile.
Learn more about our digital asset allocation and portfolio construction solution.
[1] Portfolio Construction and Global Asset Allocation: A Practitioner Solution to a Black-Litterman Flaw by Simon Nocera (Source: SSRN)