
Despite a pandemic, economic misery, and a dangerously contested election the likes of which the United States has never experienced, the equity market continues its upward march and breaking new records in the process. Indeed, many pundits point out to the enormous rally of the mega caps as evidence of a bubble. We disagree, and if anything, we believe the market has behaved very rationally.
The issue is once again with the wrong choice of metrics, and in particular with the blind faith put in equity multiples such as Price Earnings ratio to measure financial value. To be sure, and as illustrated by the following graph, this ratio continues to rise (i.e., valuations based on this metric are becoming more demanding) and has actually “exploded” as of late:
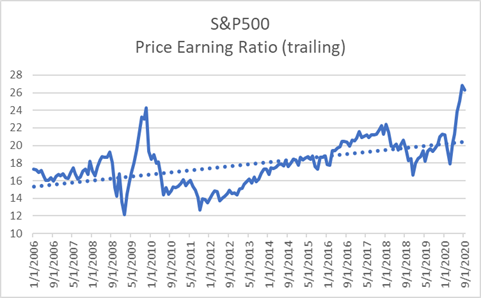
The trouble is that, as we “preach” on every occasion[1], equity multiples have nothing to do with measuring financial value, i.e. nothing to do with measuring the capability of an asset to generate cash flow. They are a fast-moving price divided by an accounting suggestion, i.e. a variable subject to subjective interpretation (i.e. cash is a fact, Earnings is an opinion). And they are at best a momentum indicator used by speculators to “buy low and sell high”.
As defined by the most powerful law in finance (and widely accepted!): “the value of any asset is equal to the sum of the future cash flow, discounted back to present value”; notice that the lower the discount rate, the higher the present value. The discount rate used in the process is conceptually composed of two elements: the time value of money, e.g. the fixed income yield of bonds, and an Equity Risk Premium (ERP) or a premium over and above the fixed income yield to compensate the investor for the greater risk taken. Accordingly, the wider the ERP, the more rewarding the investment.
Applying this indisputable construct, and in sharp contrast with the graph shown above, it turns out that the market is far from over extended. As illustrated by the graph below, the ERP in fact has not shrunk as would be the case for an expensive market in bubble territory; the ERP has widened thus pricing in more risk but higher rewards, i.e. value:
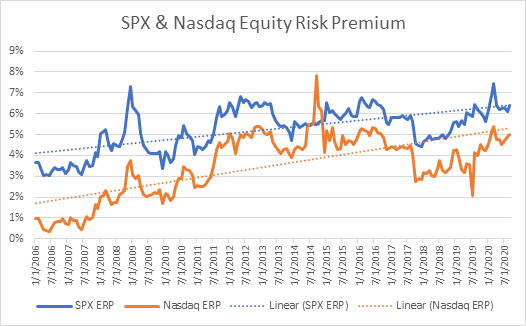
Source: Lumen Value Compass[2]. Discount rate minus 10y UST Yields.
In other words, the market has simply been playing catch up with underlying fundamental value:
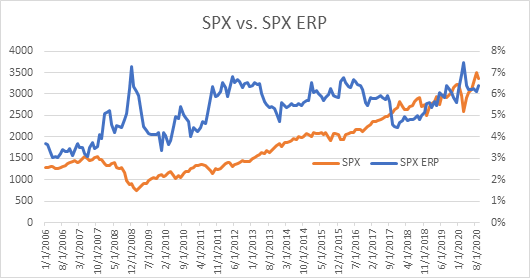
To be sure, a sizeable element behind the ERP widening has been the sharp decline in UST yields. However, that only reinforces our point as the overall discount rate, a.k.a. expected market return, a.k.a. capitalization rate, has not budged much, continuing to hoover at around 7% or very much in line with its historical range … not much of a bubble there!
In conclusion and recalling the angst around the mega caps rally mentioned above, we must conclude that the market has behaved rationally: wider profit margins protected by impenetrable moats, growth “forever”, and wider ERPs or equivalently unchanged discount rates, are plenty of fundamental reasons to justify recent performance.
[1] See Nocera, Simon E., Equity Multiples: Myths, Mania and Alchemy – A Valuation Riddle … Wrapped in a Mean Reversion Mystery … Inside an Accounting Enigma (July 12, 2020). Available at SSRN: https://papers.ssrn.com/sol3/papers.cfm?abstract_id=3680133
[2] The lumen Global Value Compass is a proprietary algorithm that extracts from the market the implied discount rate. The Compass is based on live market data, a three-stage DCF, and a reverse engineering algorithm. The Compass does not employ subjective views or forecast or data mining, thus delivering an unbiased and universal metric, i.e. only what the market implies across all major global asset classes.
Lumen Global Investments, San Francisco, November 14, 2020